
Skip to content
Peakyas
EN
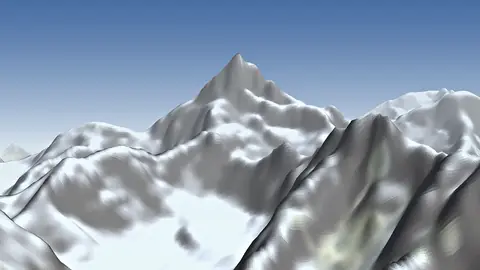
Mountains with snow

Mountain·PakistanPakistan

Uli Biaho

6,109m

Baltoro Muztagh

Summit weather

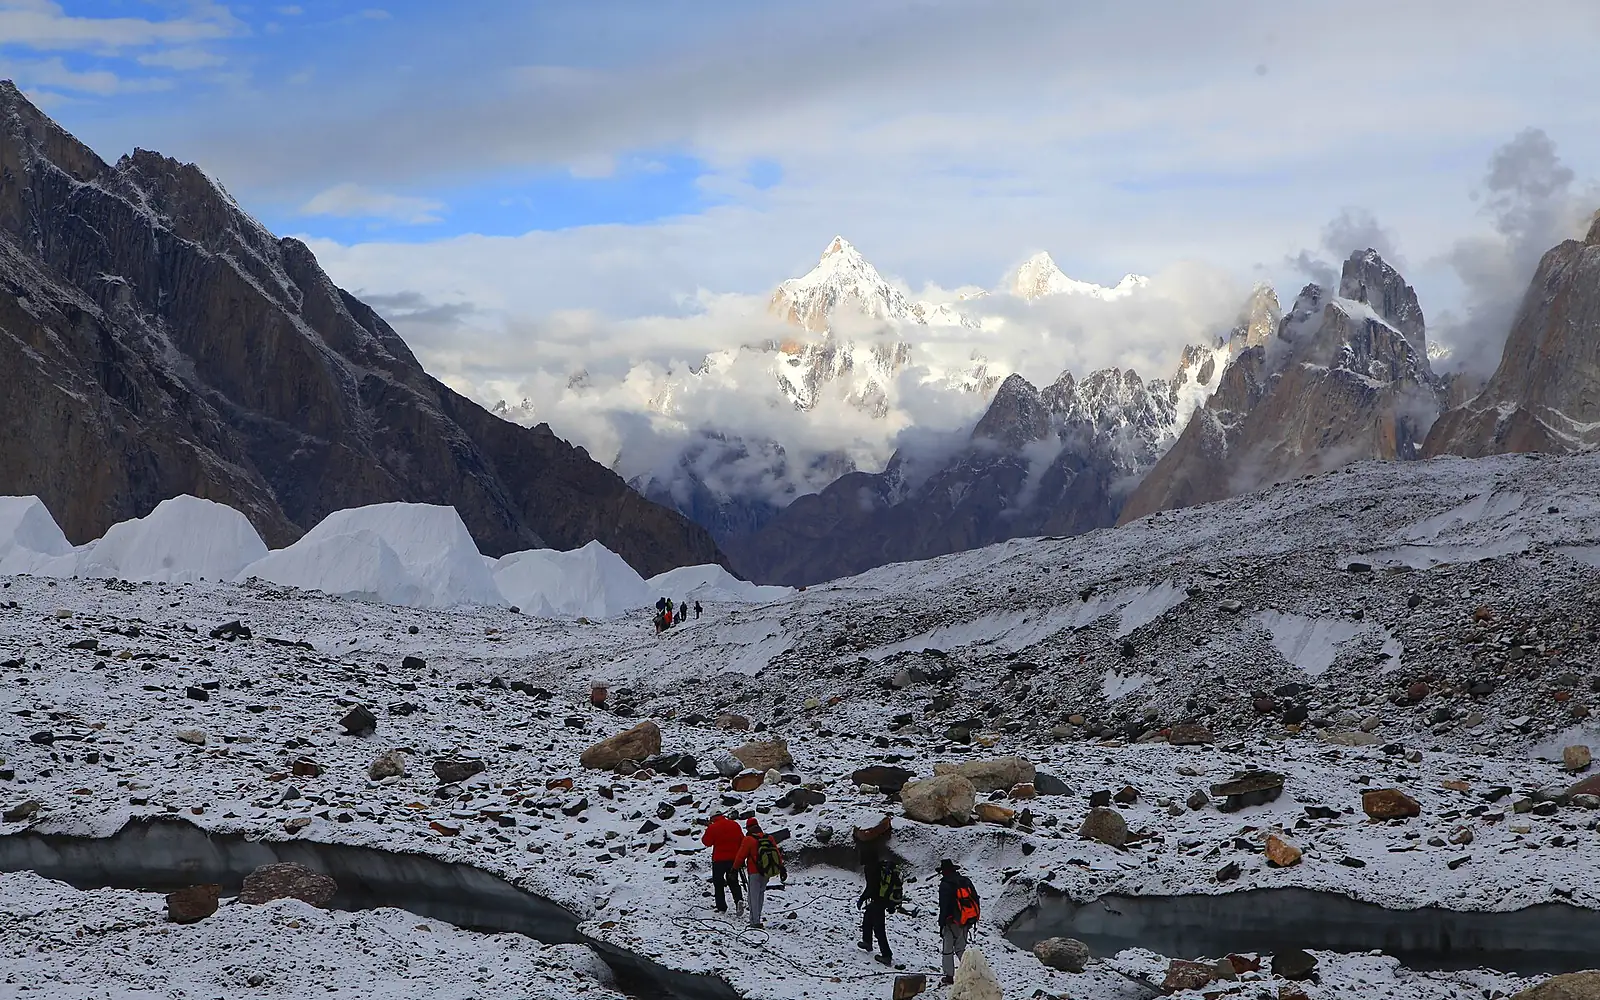
Muhammad Nazir Baltistani · CC BY-SA 4.0 · Wikimedia Commons

Elevation
6,109m
Prominence
509m
Relief
2,305mabove the lowest point within 5 km
Steepest slope
74°within 1 km of the summit
Snow at the summit
All yearSee month by month ↓
Summit
35.7364°N, 76.1158°E

Mountain in Pakistan

Uli Biaho is a mountain in the Baltoro Muztagh (Pakistan). Its summit stands 6,109 m above sea level. Its prominence — how far it rises above the highest saddle linking it to a taller summit — is 509 m.

From the lowest point within 5 km (3,804 m), it rises 2,305 m. The steepest side is the east face: 50° on average over the first kilometre. In places the ground near the top reaches 74° — terrain for climbers, not walkers.

Read more on Wikipedia

Scores

Uli Biaho for skiers and climbers

Two scores out of 10, built only from open data — every part is shown. They describe what the mountain offers, not how safe it is.

Hiking & mountaineering

4.5/10

Difficulty to the top

Alpine climb

Glaciers around the top.

Indicative only — never a safety assessment. Conditions change: ask local guides and check the forecast.

  • 0.0/2.50 waymarked routes and 0 path sections nearby
  • 0.0/1.50 huts and shelters
  • 2.0/22,305 m of ascent from the valley
  • 1.2/1.5509 m of prominence
  • 1.0/1.54 months with summit afternoons above −5 °C
  • 0.3/1via ferratas, climbing and glaciers
Ski score

—

No ski runs within 12 km in OpenStreetMap.

How these scores are made

Ski (where OpenStreetMap has skiing within 12 km): up to 4 points for the length of downhill runs (300 km or more = 4), 1.5 for the number of lifts (40+), 1.5 for the vertical between lift stations (1,500 m) and 3 for the snow season — a month counts when the estimated mean temperature at the height of the ski area is −1 °C or lower and snow falls or lies there (NASA POWER, 2001–2020). Hiking & mountaineering: up to 2.5 for waymarked routes and paths, 1.5 for huts, 2 for the ascent from the valley (2,000 m), 1.5 for prominence (3,000 m), 1.5 for the season (months with summit afternoons above −5 °C) and 1 for via ferratas, climbing and glaciers. OpenStreetMap is built by volunteers: where few things are mapped, a score can be lower than reality.

Plan your visit

Stay, climb and get there

Some links above are affiliate links: if you book through them we may earn a commission, at no extra cost to you. It never changes what the data on this page says.

Snow

When there is snow on Uli Biaho

At the summit, snow all year round. Month by month below, at different heights on the way up.

JanFebMarAprMayJunJulAugSepOctNovDec
Summit6,109 msnow all year round
Snow on the ground all monthSnow on the ground all monthSnow on the ground all monthSnow on the ground all monthSnow on the ground all monthSnow on the ground all monthSnow on the ground all monthSnow on the ground all monthSnow on the ground all monthSnow on the ground all monthSnow on the ground all monthSnow on the ground all month
Halfway up4,956 msnow from February to July (some years from September to July)
Snow some of the timeSnow on the ground all monthSnow on the ground all monthSnow on the ground all monthSnow on the ground all monthSnow on the ground all monthSnow on the ground all monthNo snowSnow some of the timeSnow some of the timeSnow some of the timeSnow some of the time
Foot of the mountain3,804 msnow from February to April (some years from November to May)
Snow some of the timeSnow on the ground all monthSnow on the ground all monthSnow on the ground all monthSnow some of the timeNo snowNo snowNo snowNo snowNo snowSnow some of the timeSnow some of the time
  • Snow on the ground all month
  • Snow some of the time
  • No snow
  • This month

Estimate for a normal year: average temperature and precipitation from NASA POWER, carried to each height, in a simple model of snow building up and melting. In a given year snow can come earlier or stay longer. It does not replace the local snow and avalanche bulletin.

Summit weather

Uli Biaho, month by month

Not a forecast: long-term averages (1991–2020), carried up to the summit. The orange line is where an average afternoon reaches 0 °C; above the dashed blue line it freezes even at dawn.

On an average July afternoon the summit reaches about 1 °C; on January nights it falls to about -32 °C. In 10 months of the year it stays below freezing at the top even in the afternoon. In July the 0 °C line climbs to about 6,230 m, above the summit: the top thaws on an average afternoon. Across the region, October is the driest month (10 mm) and April the wettest (32 mm).

1,000 m2,000 m3,000 m4,000 m5,000 m6,000 mSUMMIT · 6,109 mJanuary: 2,360 mFebruary: 2,680 mMarch: 3,400 mApril: 4,250 mMay: 4,940 mJune: 5,630 mJuly: 6,230 mAugust: 6,220 mSeptember: 5,480 mOctober: 4,420 mNovember: 3,460 mDecember: 2,710 mJanFebMarAprMayJunJulAugSepOctNovDec
0 °C on an average afternoon 0 °C at dawn the summit
MonthSummit high °CSummit low °C0 °C line (m)Rain & snow (mm)Wet daysSun h/day
January-24-322,3602854.9
February-22-302,6803165.8
March-18-263,4003068.3
April-12-204,25032710.1
May-8-164,94026611.2
June-3-125,6302669.7
July1-96,2302869.6
August1-96,2203068.8
September-4-135,4801948.3
October-11-194,4201027.9
November-17-253,4602037.0
December-22-292,7101435.5

Estimate: the NASA POWER climate of a ~55 km cell (average height 4,587 m), adjusted to the summit by −6.5 °C per 1,000 m. Rain, wet days and sunshine are those of the region. Mountain weather changes fast — always check a local forecast. ★ = mildest months at the top.

Relief

The mountain in profile

Two cuts through the summit, 16 km long, from the 30 m Copernicus elevation model. True scale: no vertical exaggeration.

West – east
6,109 m3,868 m0 km2 km4 km6 km8 km10 km12 km14 km16 kmWE
South – north
6,109 m3,346 m0 km2 km4 km6 km8 km10 km12 km14 km16 kmSN
Steepness by direction
30°N: 44°NNE: 29°NEE: 50°ESE: 50°SES: 42°SSW: 37°SWW: 24°WNW: 41°NW

Average slope of the first kilometre from the summit. The orange petal is the steepest side.

Around the mountain

Huts, lifts and trails around Uli Biaho

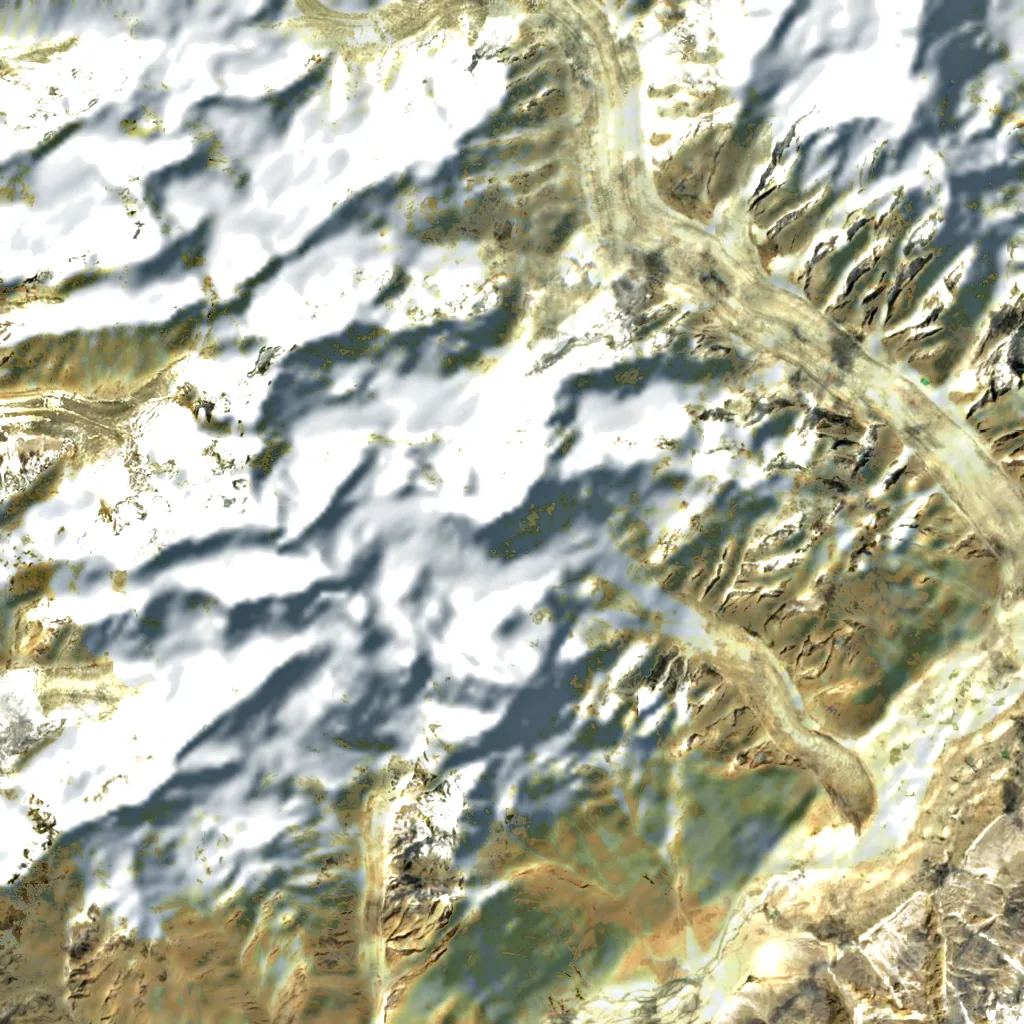
Counted around the summit in OpenStreetMap, the map anyone can edit. The satellite plate shows 14 × 14 km.

Uli Biaho seen from above (Sentinel-2) N 5 km

Sentinel-2 cloudless 2016 (EOX, CC BY 4.0), 14 × 14 km, north up. Points © OpenStreetMap contributors.

  • —mountain huts and shelters
  • —cable cars, gondolas, chairlifts and rack railways
  • —ski areas
  • —waymarked hiking routes
  • —via ferratas
  • —climbing crags and routes
  • 8named glaciers

    Dunge Glacier, Uli Biaho Glacier, Choricho South Glacier, بالتورو گلیشیر and 4 more

  • —viewpoints
  • 2campsites

    Paju, Liligo

  • —hotels, B&Bs and chalets
  • —restaurants and cafés

OpenStreetMap is built by volunteers: a low number may just mean nobody has mapped it yet. Places © OpenStreetMap contributors (ODbL).

Photos

Seen by climbers and visitors

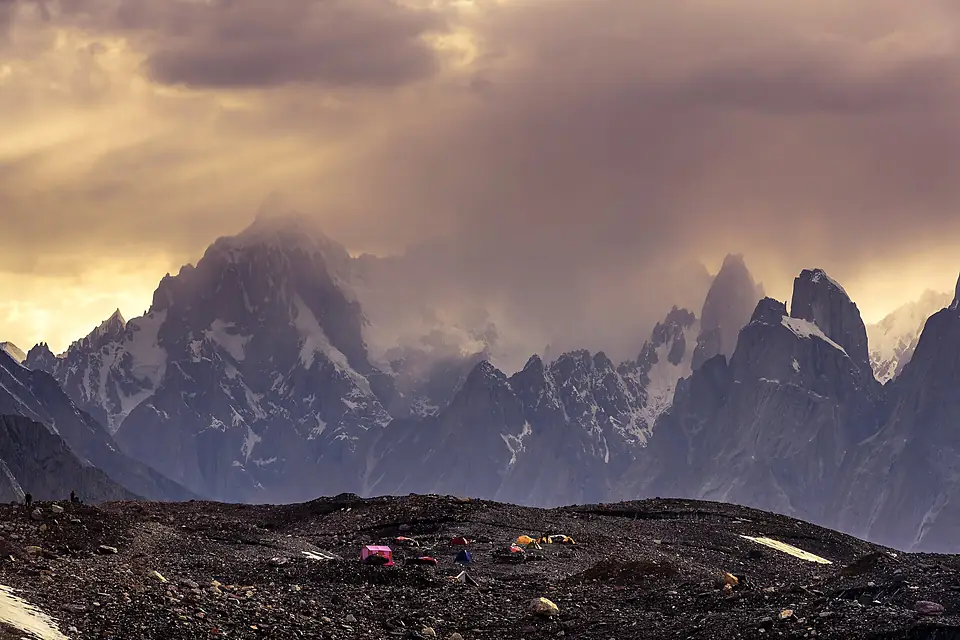
This is one of the best campsite you can find on earth, surrounded by 4 8000m mountains and hundreds of 5000m,6000m and 7000m peaks
Maqsood aktar · CC BY-SA 4.0
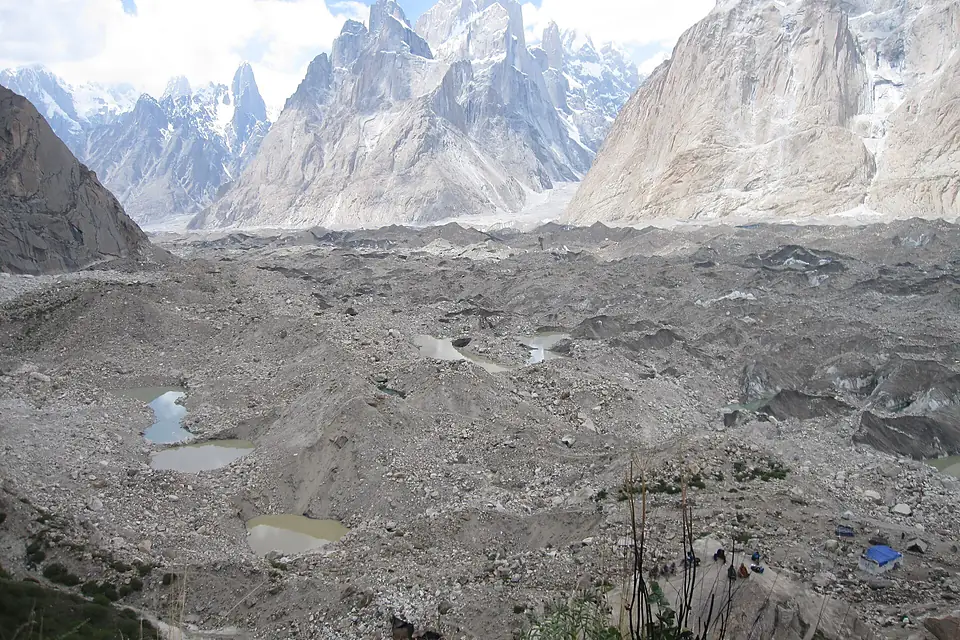
Baltoro from Urdukas campsite
Shikari7 · CC BY-SA 3.0

Recent years

How each month compared at the summit

Afternoon high at the summit (estimate). The first row is the reference, the 1991–2020 average in °C; the years show only the difference.

JanFebMarAprMayJunJulAugSepOctNovDec
1991–2020 average-24-22-18-12-8-311-4-11-17-22
2020−1.7+0.4−0.5−1.0−0.9−1.5−2.3−0.3−0.3+0.5−0.7−2.2
2021+0.2+1.7−0.4−3.0−0.9−1.0−0.1−1.4+2.2−0.2−1.0−0.5
2022−0.1−1.4+2.0+2.5+1.5−0.4+1.6−0.1+2.0+0.6−1.5−0.3
2023−0.1+1.0+1.1−1.0−2.1+0.4−0.7+0.5+0.9+0.1+1.5+2.0
2024+3.0−1.4−0.6−0.6+1.5−0.4+0.3+1.4+1.9+2.1+2.3−0.1
2025+1.7+0.8−0.8+1.3+2.8+2.5+2.2+1.4+2.5+0.7+1.1+3.3

+1 warmer than usual −1 cooler than usual

About these numbers

Names, elevation, prominenceWikidata (Q1671716) · CC0
Relief, 3D view, profilesCopernicus DEM GLO-30 · © DLR e.V., © Airbus Defence and Space GmbH, Copernicus/ESA
ClimateNASA POWER, 1991–2020 · CC BY 4.0
Around the mountain© OpenStreetMap contributors · ODbL
ImagesEOX Sentinel-2 cloudless 2016 · CC BY 4.0; Wikimedia Commons

Every figure is an average, an estimate or a count from a public dataset. Licences and methods: data sources.

The family

Do you prefer beaches, lakes, mountains, waterfalls, islands, rivers or canyons?

Same idea, other landscapes: field atlases built on open data, month by month, in seven languages.

beachesCoastyaFind your beach: sea temperature, sun and swimming month by month.Visit
lakesLakeyasEvery lake on Earth: water temperature, ice, depth and the shore.Coming soonVisit
mountainsPeakyasEvery summit in 3D: summit weather, the 0 °C line, huts and trails.You are here
waterfallsCascadyasEvery waterfall: height, flow month by month and when it roars.Coming soonVisit
islandsIslandyasEvery island from the sea up: size, sea temperature, ferries and 3D.Coming soonVisit
riversRiveryasEvery river from source to sea: the journey, the flow and the basin in numbers.Visit
canyonsCanyonyasEvery canyon cut to scale: depth to the floor, rim and floor temperatures, trails and viewpoints.Coming soonVisit